
How To: Create Expanding Bump Charts Using Set Actions with Tableau

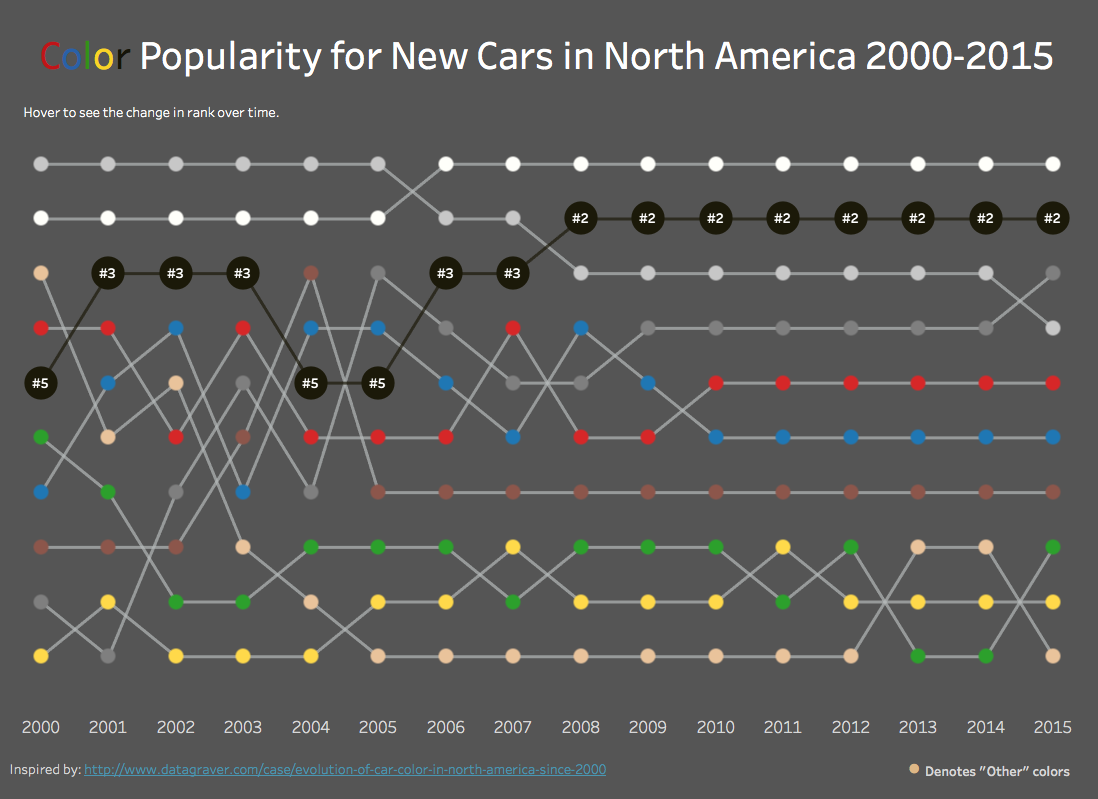
Before we had set actions, Rody Zakovich wrote a post on custom UI/UX interactions that he had built in Tableau using data modeling techniques. One of the interactions I really liked was the expanding bump chart. Now that we have set actions, this is fairly easy to implement, and I wanted to apply it to one of my existing visualizations on the popularity of car color over time.
To start, we need to build a basic bump chart. Here's a tutorial that will walk you through that. Now let's start from the point of a basic bump chart.

The first thing we need to do is create a set for our colors since that is what we will be interacting with.

For this to work, we need to make a calculation that will size the circles when we hover over them. We will make a simple calculation that checks if we are hovering over a color, and if so, we will make the circle 5 times bigger than the circles that we are not selecting.

We also need to make a calculation to display the ranking on the circle when hovering.

We now put Set Size on the size marks card and Color Rank Display on the Label marks card.

This step is optional and somewhat tedious, but I wanted the lines to be grey if they aren't selected and colored if they are. So we can make a calculation for that as well.

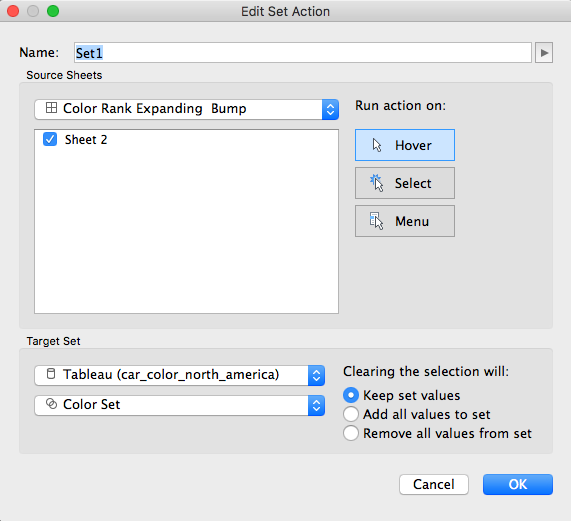
Now to setup the dashboard action. Click Dashboard/Actions/Add Action/Change Set Values and setting the action to update Set State on hover and keep set values when clearing the selection.
Now the bump charts should expand when hovering!
Feel free to download the workbook and comment with any questions.


0 comments:
Note: Only a member of this blog may post a comment.