
How To: Tableau Sheet Selector with Dashboard Actions

One of the very first tricks I learned in Tableau was how to create a sheet selector. I used this trick in one of my first Tableau Public visualizations on Tommy John surgery. This was the first time that I realized you could add additional functionality to Tableau even if said functionality is not supported out of the box. Adding a sheet selector let's the user change the sheet within a dashboard without moving to another dashboard. This technique relies on using a parameter to change a filter that hides or shows dashboards within a container.
This is a tried and true technique, but I wanted to be able to do it without using a parameter. I wanted to be able to use different user interface elements to drive the sheet selector, so I will show you two different options.
Option 1: Driving the sheet selector with a shape

This method allows the user to design a user interface where iconography can be used to change the sheet that is shown. Here's how it's done:
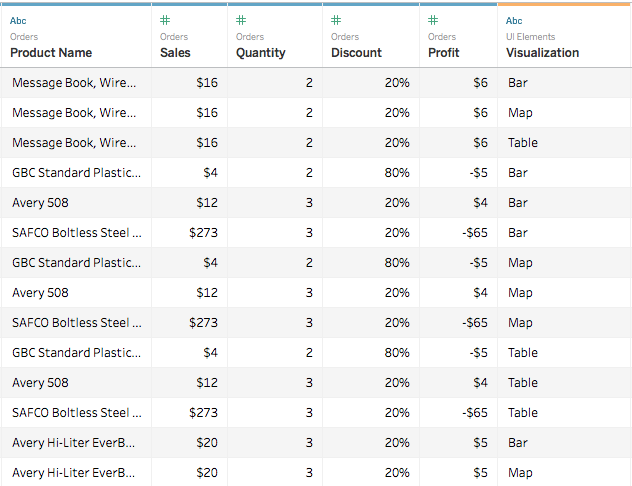
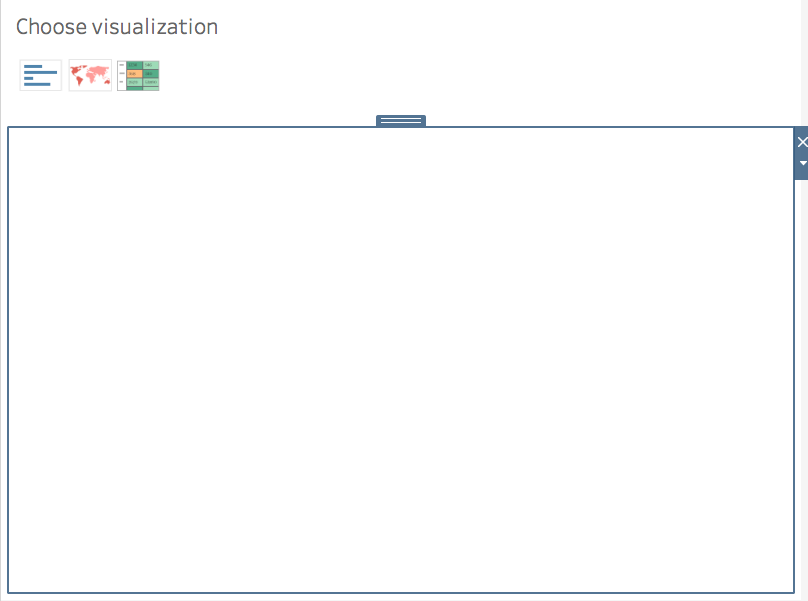
1. First, you will need to create a spreadsheet with a list of views that you will be selecting. In this case, I am going to allow the user to switch between a bar chart, a map, and a table.

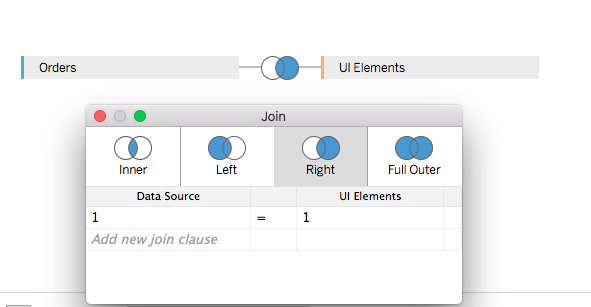
2. Join this file to your existing file using a right outer join with a join calculation of 1=1. This allows all visualization types to tie to each record of your data set. This will allow us to filter later.
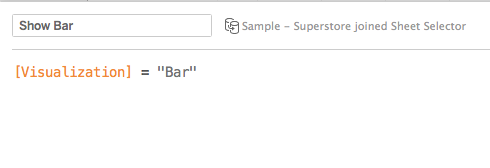
3. Create the visuals that you would like to select. You are now ready to create the filters that will allow the sheets to show or hide. First, create a calculation that will serve as a boolean filter for showing the charts. You will need to create this for each chart type.
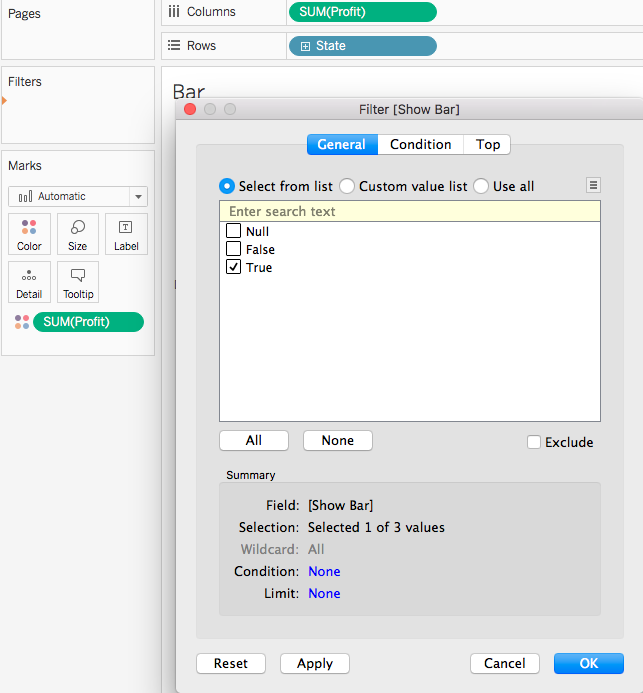
4. Drag each filter to each chart and choose True.
5. Create your shapes that will filter the view.
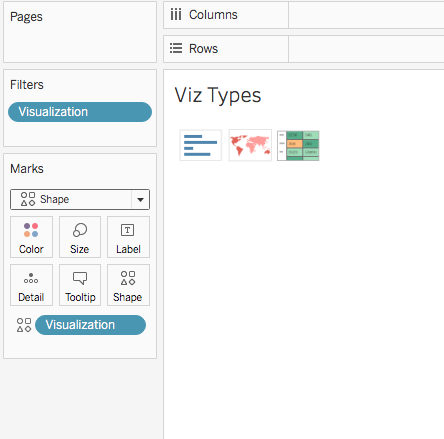
6. Now we can start to put the dashboard together. Drag your shape worksheet into the dashboard and add a container.
7. Drag the three charts into the container.

8. Create a dashboard action filter. The chart with the shapes should be set to filter the other three charts. In this case, we want to set clearing the selection to "leave the filter" so that only one chart shows.

You should now have a dashboard that changes sheets and is driven by a user interface element such as a shape instead of using a parameter!
After I finished up this technique, I mentioned it to Ken Flerlage to see if he would find it useful, and lo and behold he had previously implemented almost the same technique in his amazing Beauty of Pi viz.
Option 2: Driving the sheet selector with a chart
This method allows the user to click on a chart and change the other sheets in the dashboard. This method does not require joining in the additional file.
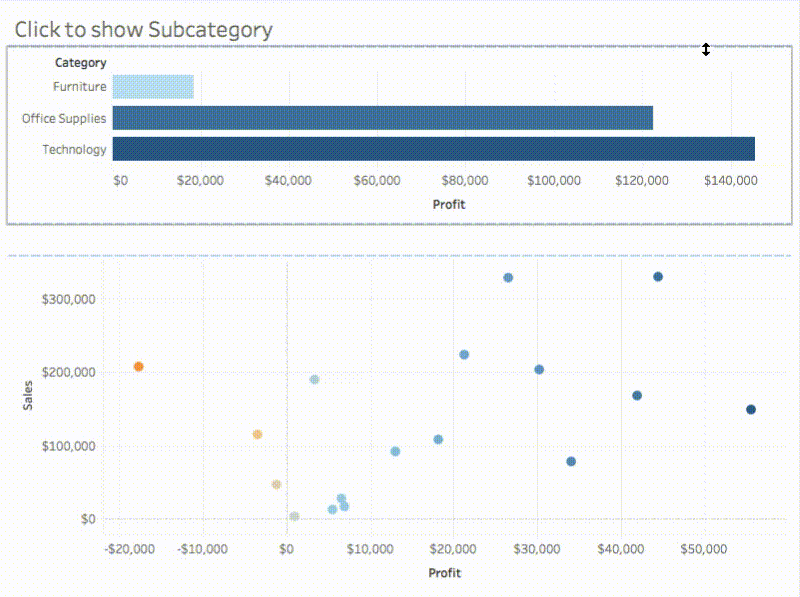
1. Create the visuals that you would like to select. In this case, I am going to swap a sales/profit scatterplot for a subcategory bar chart.
2. Once again, drag on a container and drag the charts inside.

3. Create a dashboard filter action to filter the charts inside the container when clicking the top Category bar chart.

4. Create a boolean calculation to show/hide the charts. In this case, the level of detail calculation is detecting whether only one category is selected. This allows the chart to be shown or hid based on one or more categories.

5. Click on the category chart and navigate to the subcategory chart while the selection is still made. Drag Show/Hide Chart to the filter and select "True."


6. Now navigate back to the dashboard and click off of the chart. Navigate to the scatter plot and drag Show/Hide Chart to the filter. Choose "False" as we do not want this view to appear when we have clicked on the Category.


Now you have a dashboard that is able to switch sheets based on clicking a chart!

Feel free to download the workbook and comment with any questions.


0 comments:
Note: Only a member of this blog may post a comment.