
How To: Sheet Selector Using Set Actions in Tableau

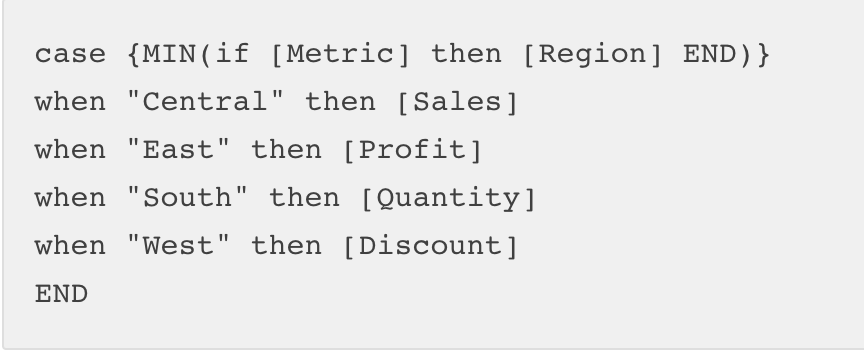
For some time now, I have been thinking about how to use Set Actions to create a sheet selector. In previous tutorials, I walked you through how to create sheet selectors using a join and level of detail calculations. Then, I saw a tutorial by Lindsey Poulter on how to dynamically switch metrics or dimensions, and I noticed a calculation that she had used:
I knew this could be adapted to filter sheets as well, so I started working through how to build out a sheet selector using Set Actions. The idea for this is that we can build a dashboard and create user interactions that change the actual visualization rather than just dimensions or measures. We could even use this to create our own story points if we wanted.
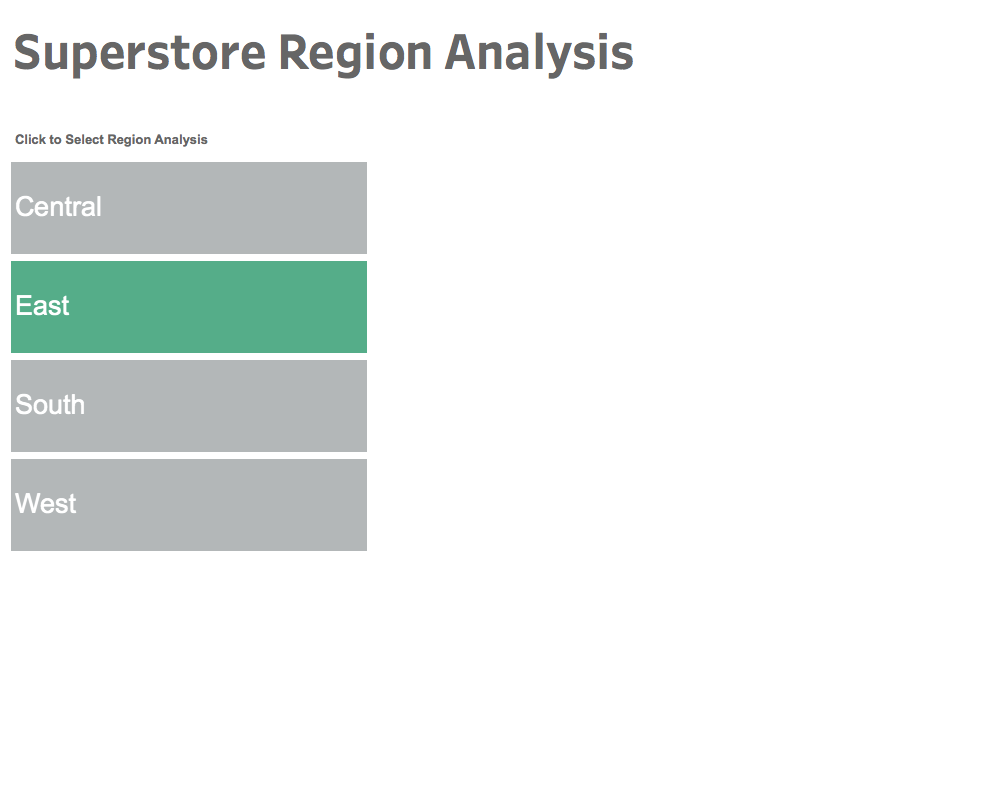
Let's take a look at how it's done. In this example, I want to create a menu list of Regions, and I will be swapping the visual for a different analysis of each region. The first thing we need to do is create our region list.
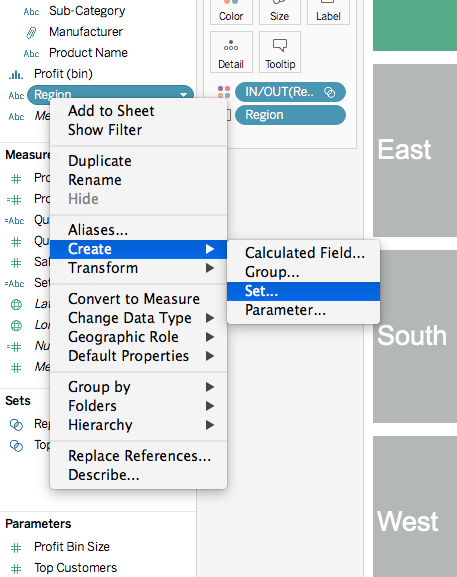
First, we will create a set on Region:

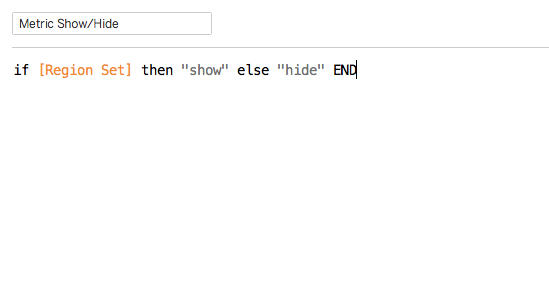
Then, we will create a calculation that Lindsey used so that multiple regions cannot be selected:
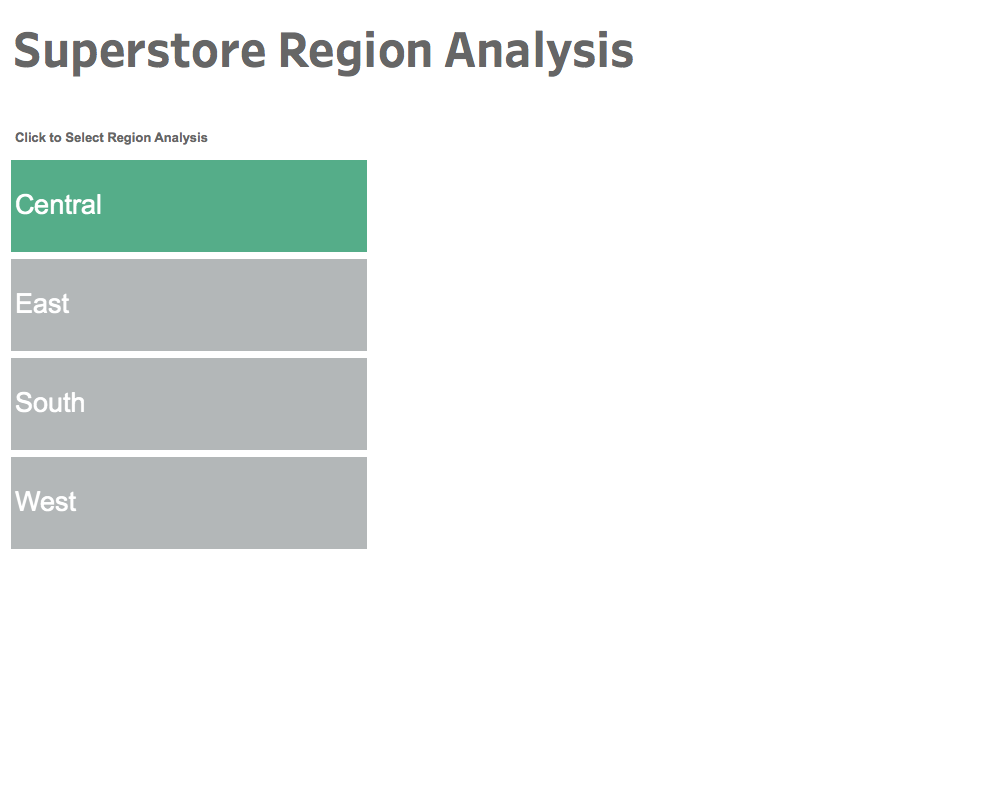
Now we can build our view like so:
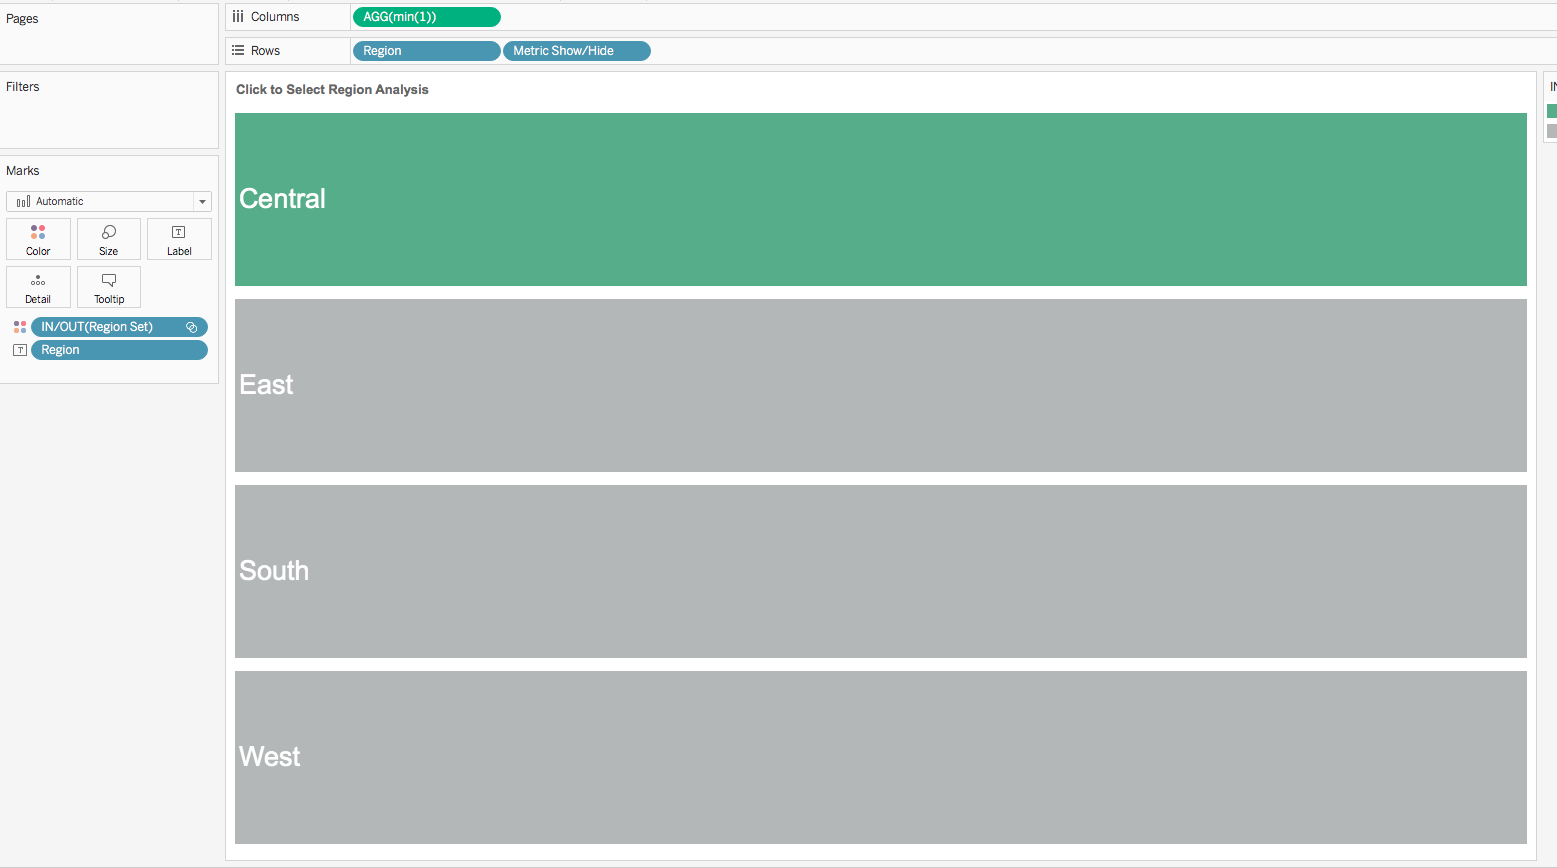
Notice we have put the Region Set on Color. This will allow the colors to change once the Set Action is created.
Now we can create the calculation that we adapted from Lindsey's tutorial to cause the sheets to filter.
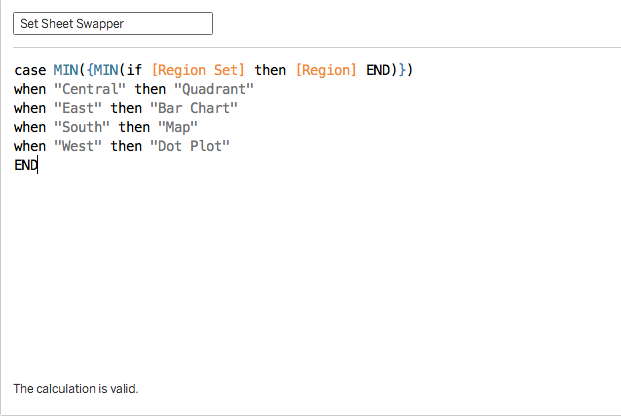
Essentially, we are going to check that the region has been clicked and then evaluate it to know which type of chart will be displayed. In this case, I want a quadrant chart that I have created to display when I click Central, and a barbell chart when I click East, etc. You can customize this however you want to match the charts you have created.
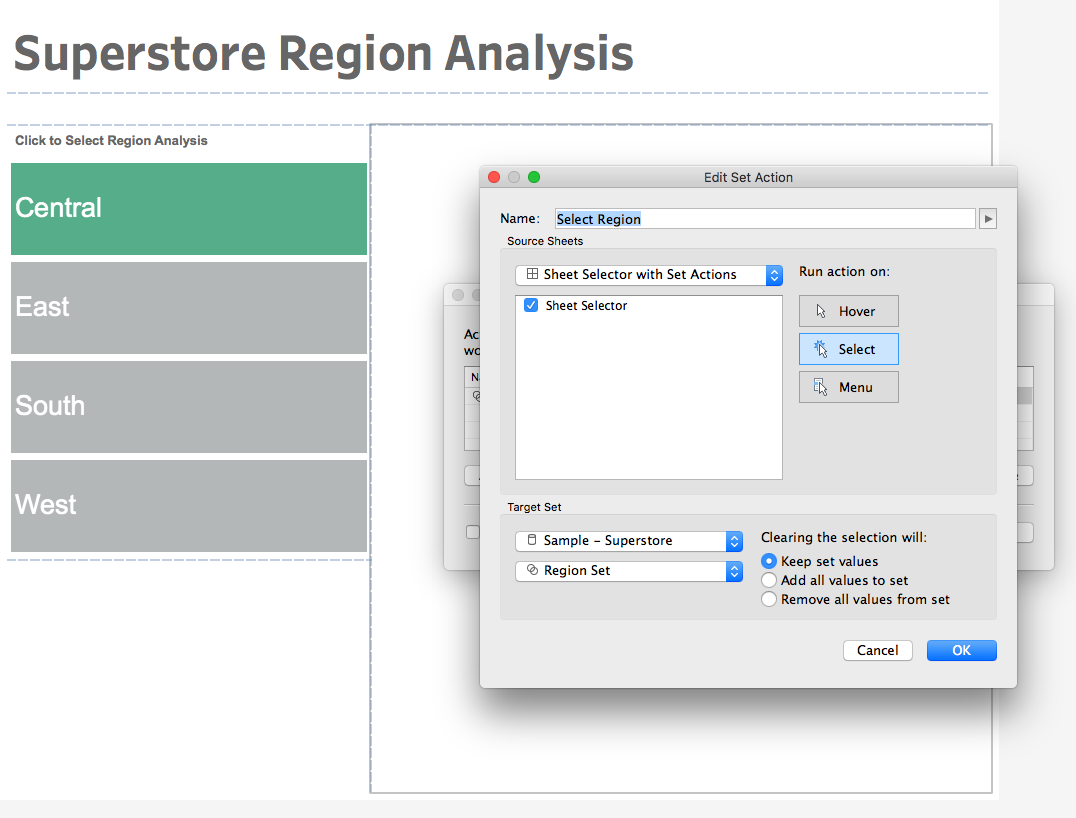
Now, we can begin to set up our dashboard and the Set Actions that will drive the sheet selector. Create a dashboard and then create the following Set Action:
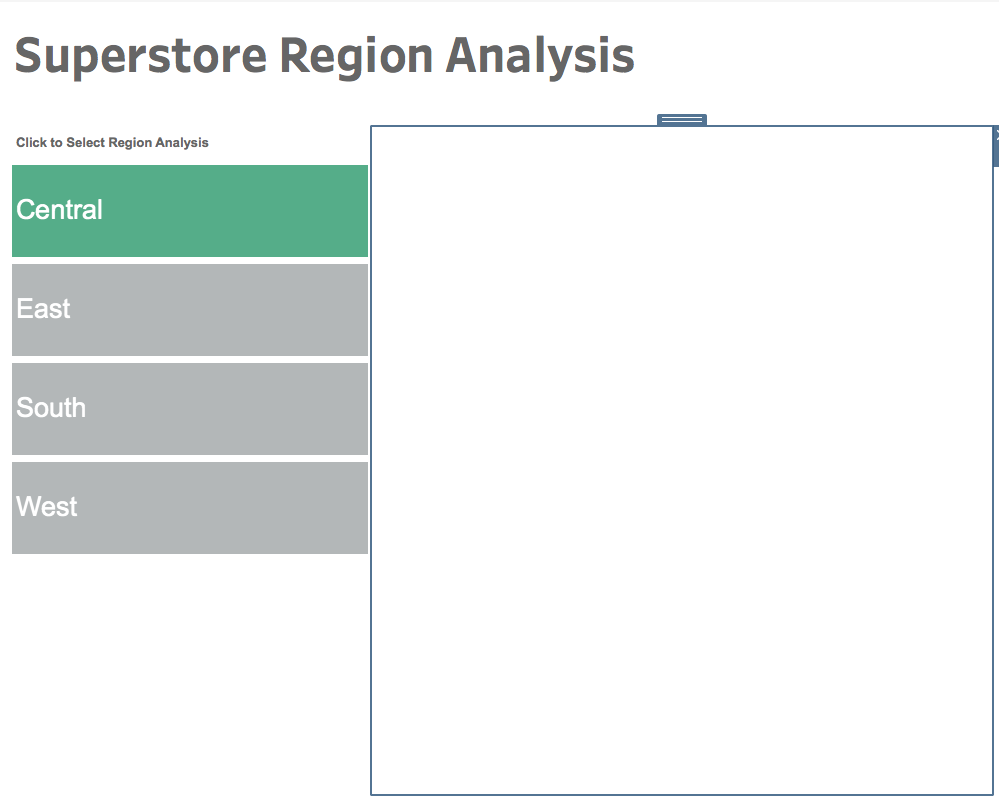
Now add a vertical container to the dashboard. We are going to click on each region on our navigation, apply the filter for the sheet selector, and then drag the chart into the container.
Click Central on the nav, drag your central chart into the container, and hide the title. In this case I have a quadrant chart.

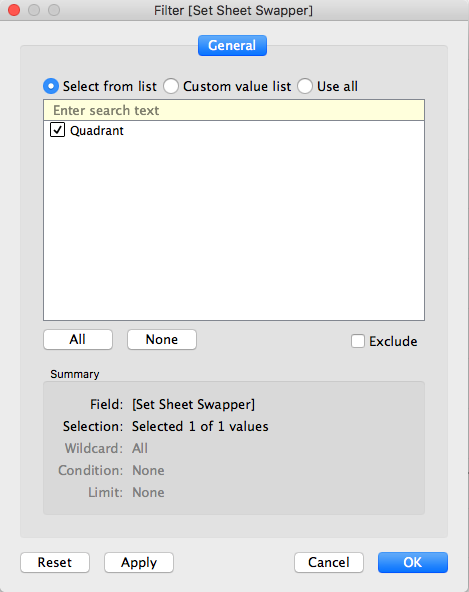
Now, go to the sheet for the central chart and apply the Set Sheet Swapper filter. Since I have already clicked Central, the calculation will return Quadrant. Click the quadrant check box and click apply.

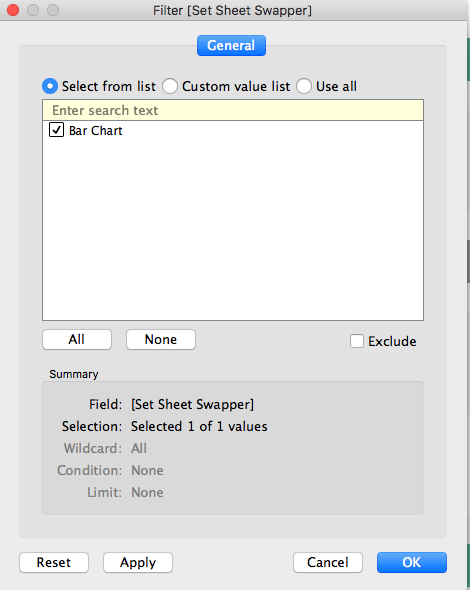
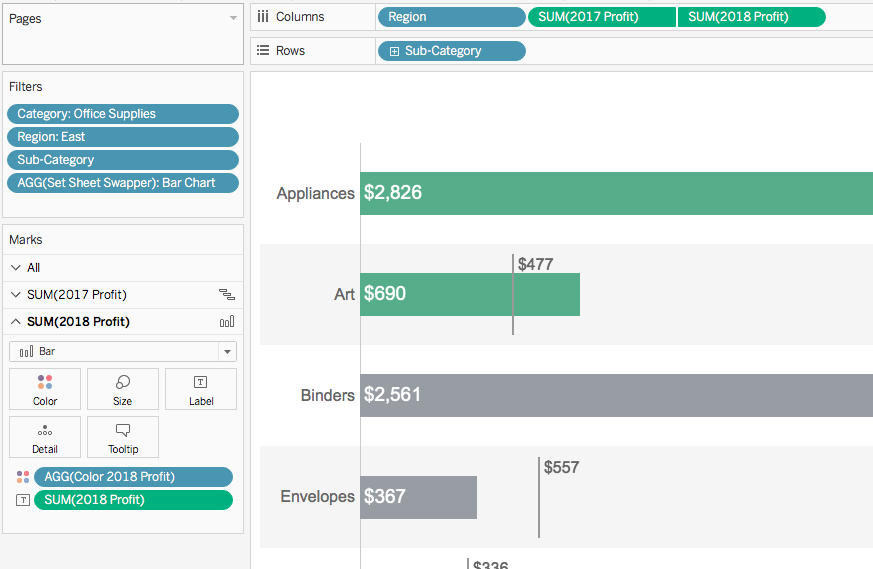
Now, go back to the dashboard, click East, drag the bar chart into the container, hide the title, and then apply the filter to the bar chart sheet.
Repeat the process for any remaining charts, and you will have a sheet selector driven by a Set Action!
Feel free to download the workbook and comment below with any questions.


0 comments:
Note: Only a member of this blog may post a comment.