
How To: Using Ranks to Create Slope Graphs in Tableau

I originally learned how to create slope graphs in Tableau using Andy Kriebel's excellent tutorial. Andy's tutorial details how to use the rank function in Excel to prepare your data before building the slope graph in Tableau. However, I wanted to build a slope graph for my Iron Viz dashboard, and I was not able to modify or transform the source data as I was given a .twbx file with an extract.
Tableau's rank function to the rescue! Using the rank function, we are able to build a slope chart without having to do any transformation on our data. Let's take a look at how it's done.
Step 1: Create a calculated field for the first measure we want to rank. In this case, I am using rank_unique so that it doesn't assign the same rank to different values.

Step 2: Create another calculated field for the second measure we want to rank.

Step 3: add a dimension to the detail for the ranks to compute by.

Step 4: Drag the pill that you want on the right side of the slope graph to the rows, and then compute using the dimension you placed on the detail.

Step 5: Drag the pill you want on the left side of the slope graph to the side of the first stacked bar so that you see the two bars side by side. Release the pill there.

Step 6: Make sure both measures are being computed using the dimension you specified for ranking.

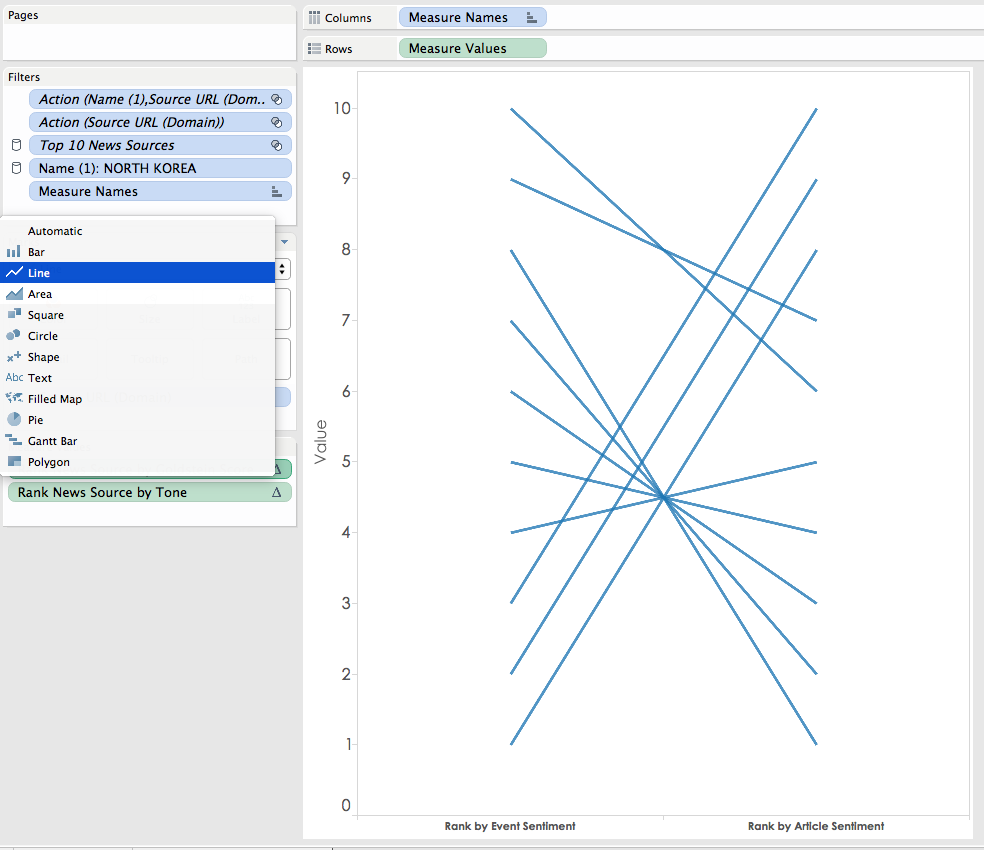
Step 7: Simply change the marks to line and you have your slope graph!
 Step 8: Add a measure to the label and choose "Line Ends" with the start and end of the line labeled.
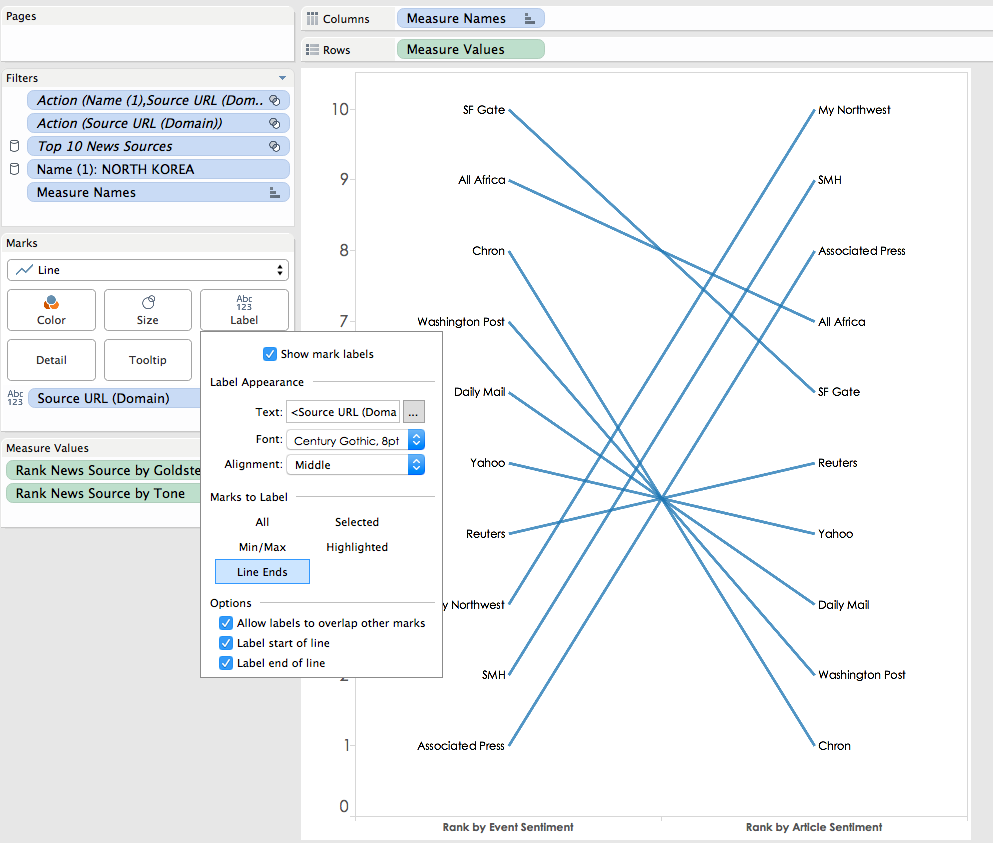 Step 9: Drag a pill to the color. In this case, I am using the Z-Score of the difference of the ranks, but you could easily substitute with just the difference of the ranks.
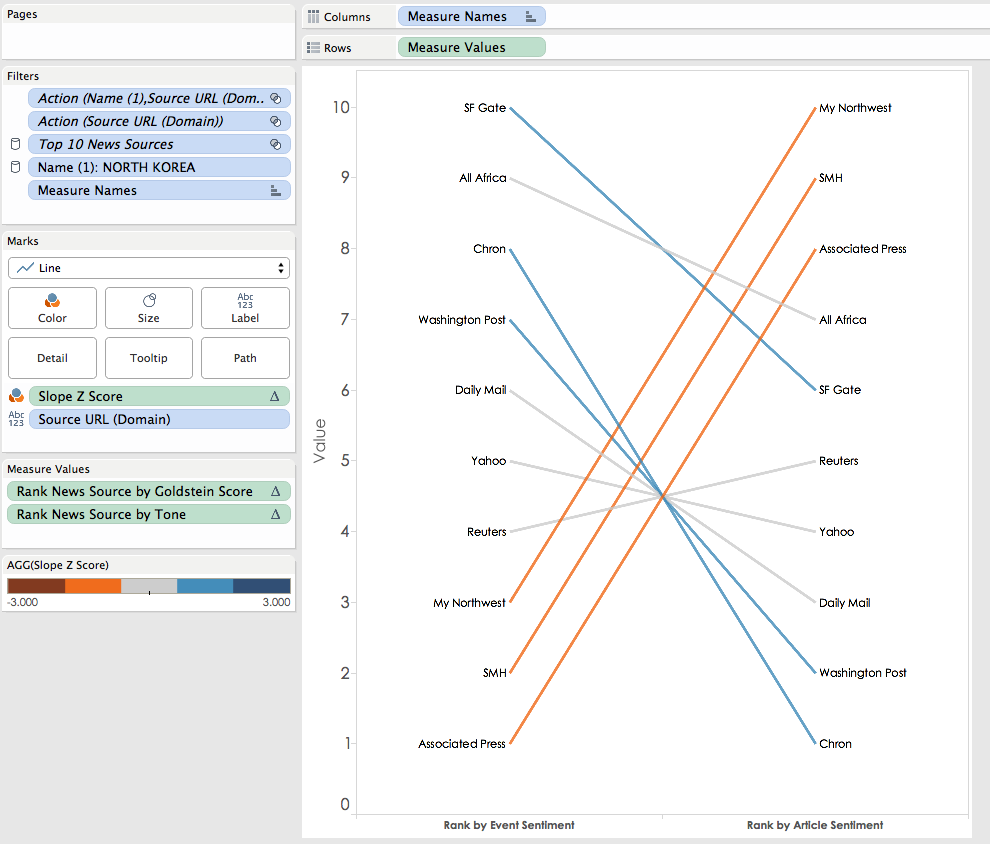 I hope you find this useful and an easier method than transforming the data with Excel. Feel free to comment with any questions.
thanks for the sharing...Can you post your dataset? or how can i find it?
ReplyDeleteHi, you can download the workbook here:
Deletehttps://public.tableau.com/profile/matt.chambers#!/vizhome/ReadAllAboutIt-BiasintheMedia-IronViz/ReadAllAboutIt-IronViz
This is a great post...very informative. I've been meaning to look into creating slope graphs in Tableau and this article is very easy to follow. Good work!
ReplyDeleteThanks Chris! I'm glad it helped.
DeleteYou can find some more diagram examples of slopes in creately diagram community.
ReplyDelete